
Your Turnaround Deserves This Powerful Heatmap
Last post, I shared how I found an expense-based turnaround to be wholly ineffective. Faced with that frustration, I dreamed that I could find a product or a customer whose profit would point the way to future prosperity. It would mean abandoning “expenses” and thinking “strategy.”
Over time, I created a rigorous analysis that leads to improved company behavior.
Today: how to build the analysis. We start with what we know intuitively but often forget: products provide varying amounts of profit. Some make money. Some lose money. In this example, let’s suppose the Hypothetical Company lists its product profits for a period as Step 1: Rank your products by gross profit.
- Product A: $140K
- Product B: $60K
- Product C: $23K
- Product D: $21K
- Product E: Loss
Same for customers. Some customers are more profitable than others. What I decided: combine these two insights into a single view.
Step 2: For each product, show the customer makeup.
For example, inside that $140K from Product A, we see the profits from a number of Hypothetical’s customers.
- Ann: $100K
- Bob: $30K
- Dan: $10K
We see that Ann drives most of Product A’s profit. Bob contributes a bit, Dan much less.
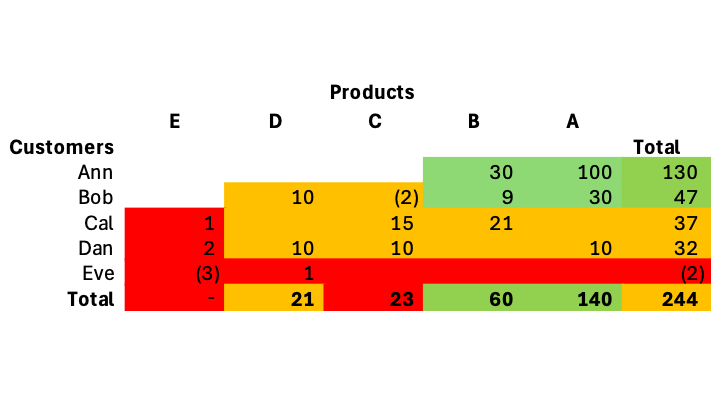
Step 3: Build out the table for the entire company. Combine the product and customer rankings into a two-dimensional figure showing every customer-product interaction for the period, and sort it, showing most profitable customers at the top and most profitable products to the right.
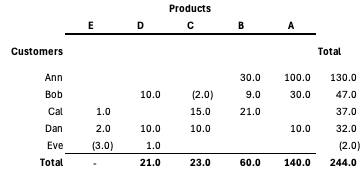
You have created a core product/core customer ™ X-Ray. A “heat map” of the company’s situation.
What does it reveal?
Top right corner? That’s your company’s CORE. These are your most profitable customers buying your most profitable products. In a turnaround, this is your focus.
Lower left corner, of course, is the NON-CORE. Loss-makers? Stop them immediately.
Or marginally profitable? Investigate. Ask questions about the company’s history. If you find past errors of strategy (think acquisitions) or measurement (improper costing) or execution (lack of process) these relationships may be rehabilitated as part of the turnaround. Or maybe not. That investigation, and the resulting action, becomes the plan for the company’s path forward.
The visual is a powerful tool to galvanize the thinking and produce an action plan. At every step, it marries your strategy to financial results—to the penny.
This tool has been very important to many of my 60+ turnarounds over 40 years.
I’m happy to spread the word, both here and in the forthcoming book, Core Turnaround Strategy. Please, please, please use this approach in your own turnarounds. I only ask that you credit the source.
Next post: What the X-Ray reveals that financial statements hide.